Lesson 9: HTML5 Graphics and Animation

Lesson 9: HTML5 Graphics and Animation

Introduction

You were expecting a ticker-tape parade, or at least a raise, when you got into the office of WatzThis.com on Monday morning. Your geolocation and maps mashup is pretty much the best thing to happen to WatzThis since . . . well, ever. But, alas, your coworkers seem to have forgotten about your magnificent achievements, and this week seems a bit quieter than usual.

The boss has been forwarding funny cat pictures to the entire office all week long, and people are starting to talk about it.

Doesn't he have better things to do?
Has he finally cracked from the pressure?
I think he may have only just discovered that there are funny cat pictures on the Web!

Whatever is going on, it's putting a damper on productivity.

Finally, after everyone has just about concluded that the boss is suddenly nuttier than a squirrel's cheeks in October, he emerges from his office and approaches your desk.

"I think we've got too much text in our app and not enough images!" he says. "I've noticed that just about everything that's popular on the Web is either an image or a video. I'm imagining something really dynamic . . . maybe animated . . . with cats and dancing babies. Are you up to the challenge?"

That settles it. He has lost his marbles. But maybe he has a point.

We've been so focused on functionality, semantic markup, and cool new features that we've neglected to pay attention to the sorts of things that make users feel comfortable with an app, or maybe even forward it to their entire address book. Namely, this app needs more eye candy.

Picture of a kitten Is this really what people are looking for?

In this lesson, you'll learn to use graphics in mobile Web apps without killing the performance of the site or costing people a fortune in data charges.

Types of Computer Graphics

One of the keys to making your mobile Web app dynamic and engaging is the correct use of graphics, animation, and video.

By "correct," I mean not only that you should use graphics in a way that is visually pleasing, but also that the graphics should be properly optimized for mobile devices.

Optimizing Web graphics requires a basic understanding of what's happening behind the scenes when computers store and display images. In this chapter, I'm going to tell you exactly what you need to know.

Let's start with the basics. Computers create images by arranging tiny dots of light, called pixels, on a monitor. (Pixel means "picture element.") If you look very closely at your monitor or use a magnifying glass, you might be able to see the individual pixels.

Unlike in the old days of film, there's no physical object that "is" a digital picture, until you print it out. In order for a computer to be able to display a picture the same way every time you want to see it, it stores data about the picture in a file.

The particular way in which the computer stores the image data is called the image format. You're probably familiar with a number of common image formats, such as JPEG, GIF, PNG, TIF, BMP, and so forth. Perhaps you've used a computer program such as Adobe Photoshop or Apple Preview, where you have multiple options for how to save or export images (as JPEG, GIF, or PNG, for example). How do you choose? The answer lies in understanding the basic types of computer graphics and image formats.

At the most basic level, computer graphics come in two varieties: raster and vector.

Raster Graphics

Raster graphics, also known as bitmap graphics, store information about color and location on a rectangular grid of the pixels that make up the graphic. The dimensions of a raster graphic are the number of pixels in the rectangular grid. For example, if an image is 800 x 600 pixels, the image contains 800 times 600 pixels (or 480,000 individual pixels).

We measure the quality of a raster graphic in the number of pixels per inch or dots per inch. Another name for image quality is resolution. Don't worry about the difference between pixels and dots for now; we'll cover that in Lesson 10.

When you increase the size of a raster graphic, the same number of pixels takes up more space, and you have fewer pixels per inch. The result is that the image will be less detailed (lower in resolution). When you decrease the size of a raster graphic, it has the opposite effect—the resolution of the image increases.

Image with some pixels enlarged for artistic effect

Computer programs that help you create raster graphics include Adobe Photoshop, Microsoft Paint, and any sort of digital camera or photo editing program.

Vector Graphics

Vector graphics store information about images using lines, shapes, and colors represented by mathematical equations. Instead of saying, "Draw a circle by putting the pixels into these places," a vector graphic format says something like, "Draw a circle with a diameter of 100 pixels" or "Connect the following dots to form a polygon." Because they use shapes and math to describe images, you can make vector graphics larger or smaller without affecting the image quality.

The original graphic

[#TOGGLE#]

Raster graphic, scaled to twice the size on the left Vector graphic, scaled to twice the size on the right

[#TOGGLE#]

A Raster Graphic scaled to twice its size losing definition, compared to another Vector graphic scaled to twice its size keeping while its definition.

[#TOGGLE#]

Vector graphics work great for illustrations, logos, buttons, shapes, and even some more complicated types of graphics and text. What they don't work well for is photos. This is because photographs contain so much detail that it's not economical, from a file-size perspective, to convert them into lines and shapes.

Computer programs that work with vector graphics include Adobe Illustrator, CorelDraw, and any illustration application.

In short: Vector graphics are great for illustrations, and raster graphics are great for photographs and more realistic types of graphics.

Please continue on to Chapter 3, where I'll explain how image compression works. Then you'll get a taste of how to use vector graphics on the Web.

Compressing Raster Graphics

Raster (bitmap) images and video account for a large percentage of the data that travels over the Internet every day. In fact, network equipment maker Cisco Systems has predicted that video alone will soon make up 90% of all Web traffic.

The larger a file is, the longer it takes to download. For people with mobile data plans that charge them by how much data they download, large files can cost them real money.

As more graphics and videos appear on mobile websites, Web developers need to become better at minimizing the impact that graphics have on the performance of mobile Web apps. The three ways of doing this are:

  • Use fewer images.
  • Use smaller images.
  • Reduce the file size of the images that you do use.

There are cases where the first or the second option is a great solution. But in other cases, it's just not acceptable to give up the benefits of using images or to use smaller ones, so we need to do whatever we can to reduce their storage and bandwidth requirements.

This is where compression comes in.

Compression is the process of making files take up less digital storage space. Why compress files?

  • Smaller files open and display from hard drives more quickly.
  • They transfer over the Internet more quickly.
  • They use less memory.
  • They use less storage space on computers.

Digital image compression works by applying some sort of digital trickery to image files. Knowing how to use compression is key to optimizing graphics for the mobile Web.

We can divide all of the different ways of compressing images into two categories: lossy and lossless.

Lossy Compression

Lossy compression works by discarding aspects of an image that you won't miss all that much. For example, if a photo contains 30 different shades of black, lossy compression will get rid of some of those shades.

It's called "lossy" because it results in a loss of image fidelity. When used correctly, it's difficult or impossible for most people to detect. When it's used poorly, or when a file is heavily compressed with lossy compression, you may sometimes see strange "compression artifacts," as shown in the following (rather extreme) example. Look at the areas of relatively solid color to see the compression artifacts.

Lossy compression resulting in noticeable loss of image quality

Original image with lossless compression

The JPEG image format and the MPEG video format both use lossy compression to store images.

Lossless Compression

Lossless compression compresses images in such a way that they can be exactly reproduced from the compressed file—with no loss of fidelity. They do this mostly by taking advantage of large, continuous areas of the same color that often occur in images. So, instead of spelling out where each pixel should go, a lossless compression algorithm says, "Draw me 2,000 black pixels."

The limitation of lossless compression is that it doesn't work well, if at all, on photographs and other types of images that don't contain large blocks of the same color. Lossless compression works great for icons, clip art, logos, buttons, and the like. The most popular lossless compression formats on the Web are GIF and PNG.

Here's a quick game to help you understand when to use lossy vs. lossless compression.

[#TOGGLE#]

For each image description on the left, match it up with lossy or lossless compression on the right. Don't worry—I won't keep track of your score!

[#TOGGLE#]

Instructions: Read the image description in the first column and decide if it should use lossy compression (such as JPEG) or lossless compression (GIF or PNG). Then read the second column for the answer.

Description Answer
Oil painting of a boy and a dog Lossy
Cartoonish illustration of dogs with gradient colors, surrounding a rectangle filled with rainbow gradient. Lossy
Photo of a real life dog. Lossy
Black silhouette of a dog with clearly defined edges. Lossless
Black outline strokes of a dog with clearly defined edges. Lossless
[#TOGGLE#]

SVG

Raster graphics used to be the only game in town when it came to the Web—but no more! The latest generation of Web browsers (including Chrome, Safari, and most mobile browsers) contain built-in support for Scalable Vector Graphics (SVG).

SVG is an XML vocabulary that you can use to describe computer graphics. A computer program (such as a browser) that knows how to interpret SVG uses the code to display images. To get a taste of how it works, try this quick exercise.

  1. Open your WebKit browser, and go to www.jsfiddle.net.
  2. Copy and paste (or type) the following code into the top-left pane, labeled HTML:
    <svg xmlns="http://www.w3.org/2000/svg" version="1.1">
      <circle cx="175" cy="60" r="40" stroke="blue" stroke-width="5" fill="gold"></circle>
    </svg>
    
  3. Press the Run button just above the HTML pane.

If you typed everything correctly, the lower-right pane of jsfiddle.net will display a circle with a blue border and gold on the inside. Try changing some of the values in the <circle> element and pressing Run again. For example, make the value of r (the radius) larger or smaller. Or change the fill and stroke colors or the position of the circle.

Using jsfiddle.net to display an SVG circle

By knowing just the location of the center and the radius, SVG can draw a circle of any size. To make the circle visible, you need to add a stroke attribute (stroke is another term for "outline"), a fill color, or both.

You can use SVG to draw any shape. For example, here's a large octagon:

<svg xmlns="http://www.w3.org/2000/svg" version="1.1" height="874" width="874">
<polygon points="257,2.441559 617,2.441559 871.558441,257 871.558441,617 617,871.558441 257,871.558441 2.441559,617 2.441559,257" fill="white" stroke="black" stroke-width="4"/>
</svg>

By combining shapes, you can theoretically create anything you want. But the angles and complexity can very quickly get too complicated to be able to write SVG code directly. Fortunately, as is the case in pretty much every aspect of computing, there are tools to make the job easier!

One such tool is SVGEdit, which you'll get to play around with in this lesson's assignment.

Embedding SVG

Once you've created or found an SVG graphic that you want to use in a webpage, the process of putting it into the page is a little different from how you use other (raster) graphics.

Follow these steps to create an HTML page with an SVG graphic on it.

  1. Open Komodo Edit, and create a new blank page by choosing File > New > New File.
  1. Type or paste the following SVG code into the blank document:
    <?xml version="1.0"?>
    <svg xmlns="http://www.w3.org/2000/svg" version="1.1">
    <circle cx="175" cy="60" r="40" stroke="blue" stroke-width="5" fill="gold"></circle>
    </svg>
    
  2. Save the document on your computer with the name circle.svg.

You've just created an SVG graphic!

Creating a SVG graphic in Komodo Edit

Now let's put it into an HTML page. Follow these steps:

  1. Create a new HTML5 document by choosing File > New > File from Template in Komodo Edit. Name the new file svntest.html, and save it in the same directory as circle.svg.
  2. Type or paste the following markup in between the <body> and </body> tags.
    <object data="circle.svg" type="image/svg+xml"></object>
  3. Save the HTML file, and then use the Preview in Browser button to see how the page looks in a browser.

An SVG circle in a webpage

Are you ready to add an animation to the WatzThis app? Then please head over to Chapter 4.

Animating WatzThis With SVG

Now that you understand how to use SVG in HTML, let's use that knowledge to add a cool animation to WatzThis.com!

Since this is our first experiment with animation in WatzThis, let's start small and simple. How about a circle that just moves around a bit between the WatzThis header and the body content?

There are three different ways to animate SVG:

  • JavaScript
  • CSS
  • Synchronized Multimedia Integration Language (SMIL)

SMIL is the language that's specifically built for animating SVG, and it's perhaps the simplest way. So we'll use that for our example. If you're interested in finding out the other ways of animating SVG, I've added a link to a good article on the topic in the Supplementary Material.

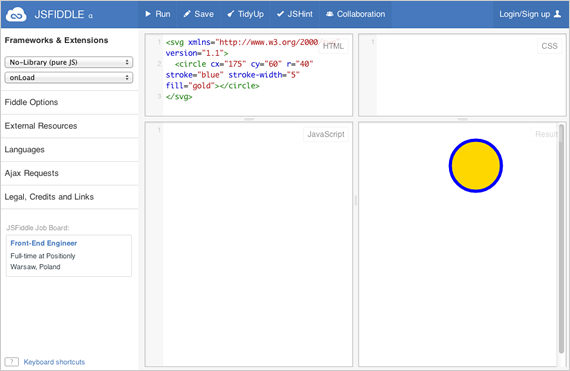
SMIL animates SVG graphics by changing the value of attributes over time using the <animate> element. Let's take a quick look at <animate> in action. Here's the SVG and SMIL code for creating and moving a circle.

<svg xmlns="http://www.w3.org/2000/svg" version="1.1">
  <circle cx="175" cy="60" r="40" stroke="blue" stroke-width="5" fill="gold">
    <animate attributeName="cx" to="0" dur="3s" repeatCount="10" />
  </circle>
</svg>

Take a good look at this code. Care to take a guess as to what it'll do?

If you guessed that the circle will transform into a pterodactyl, you guessed wrong—but you get points for creativity.

If you guessed that the circle will move from its starting point along the X axis (horizontally) until the cx attribute has a value of 0, that it will take three seconds to do this, and that it will then repeat this same movement 10 times, you guessed exactly right! How did you know all that?

To try it out in your browser, open the circle.svg file that you just created and add the <animate> element between the beginning and ending tags of the <circle> element.

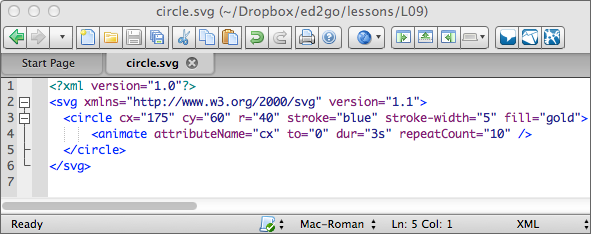
Adding the <animate> element to the <circle>

The <animate> element can manipulate other attributes as well. Remember that SVG graphics are essentially just math. So you can manipulate any of their properties to create unlimited types of animated effects.

If you wanted to make a circle that starts small and slowly gets larger, you could do that using the following code:

<svg xmlns="http://www.w3.org/2000/svg" version="1.1">
  <circle cx="175" cy="60" r="2" stroke="blue" stroke-width="5" fill="gold">
    <animate attributeName="r" to="100" dur="10s" />
  </circle>
</svg>

Now, to put an animation into the WatzThis app, open your latest version of index.html in Komodo Edit and insert an object element right above the div containing the directions. So find the part that currently reads:

<div id="container">

<div id="directions">
<ol>
  <li>Use the top row of buttons to turn the flashlight on or off, or to make the light red.</li>
  <li>Use the 2nd row of buttons to turn on and off your automatic flashing color light dance party.</li>
</ol>
</div>

Change it to:

<div id="container">
<object width="100%" height="125px" data="circle.svg" type="image/svg+xml"></object>

<div id="directions">
<ol>
  <li>Use the top row of buttons to turn the flashlight on or off, or to make the light red.</li>
  <li>Use the 2nd row of buttons to turn on and off your automatic flashing color light dance party.</li>
</ol>
</div>

Save the file.

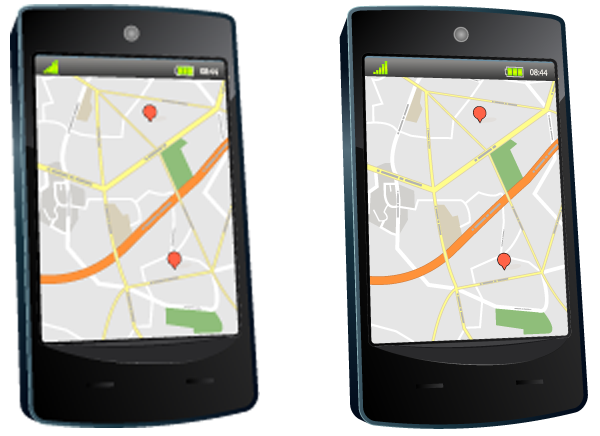
If the circle.svg file is in the same directory as index.html, and if you typed everything correctly, you can preview the app in your browser and see the animation. Here's a still picture of how it looks on an iPhone:

WatzThis app with an animated circle

Not bad, right? But it's hardly the sort of thing that people are going to forward to their entire address book. What would be super-cool would be if you had some sort of character that was moving across the screen. A quick search of a free clip art website (OpenClipArt.org) turns up just the thing.

Copy the following code into a new file in Komodo Edit, and save it as animated_ghost.svg in the same folder as the watzthis.com index.html.

<?xml version="1.0"?>
<svg xmlns="http://www.w3.org/2000/svg">
 <g>
  <title>Ghost</title>
  <svg x="-100">
  <g>
   <path id="path1928" fill="#DCE2E6" stroke="#000000" stroke-width="0.6828" d="m61.9289,50.94758c-0.1623,9.87308 6.14767,18.35825 6.81532,28.1152c-0.4594,3.60356 4.28075,9.08076 0.44525,11.07582c-4.0636,-2.49697 -5.21735,-7.93875 -8.25023,-11.52047c-3.76081,-5.90585 -6.77587,-15.18637 -11.89385,-17.31176c-3.3587,-1.39478 -1.75969,6.9068 -0.5946,10.06939c1.5126,5.57819 2.83635,11.23289 3.6307,16.96872c-0.0917,3.14579 -2.2539,11.66516 -6.29502,7.40224c-2.1521,-6.28045 -2.70217,-12.96525 -4.54059,-19.33556c-1.10762,-2.63072 -1.37718,-8.6926 -3.81768,-8.9211c-3.87983,3.37206 -2.20068,9.13503 -3.93305,13.52342c-0.94734,4.60616 -1.37111,9.33416 -2.83837,13.82274c-3.02578,-4.96761 -2.63397,-11.04386 -4.42889,-16.43405c-1.76009,-8.48392 -1.49659,-25.50752 -4.62679,-25.57714c-3.62948,-0.08034 -1.22863,19.29771 -5.97283,27.99073c-1.22035,2.06507 -2.91164,8.45481 -5.24569,6.98109c-2.01449,-4.41856 1.58647,-9.3888 -0.81336,-13.7351c-2.13408,-7.53034 -4.03626,-15.22704 -3.74463,-23.11802c-0.07225,-14.64216 4.28397,-30.24847 15.42943,-40.34114c6.83051,-5.84816 17.60137,-7.2966 25.0983,-1.84672c8.63189,5.62818 13.80269,15.41243 15.90016,25.28693c0.90079,5.60348 0.40031,11.31281 -0.3236,16.90478l0.00002,0z"/>
   <path id="path2823" stroke="#000000" stroke-width="0.6828" d="m46.14694,20.93468c0,1.32295 -1.00928,2.39536 -2.25431,2.39536c-1.24524,0 -2.25472,-1.0724 -2.25472,-2.39536s1.00927,-2.39536 2.25472,-2.39536c1.24503,0 2.25431,1.0722 2.25431,2.39536z"/>
   <path id="path2825" stroke="#000000" stroke-width="0.6828" d="m29.28912,20.93468c0,1.32295 -1.00927,2.39536 -2.25451,2.39536c-1.24503,0 -2.2545,-1.0724 -2.2545,-2.39536s1.00926,-2.39536 2.2545,-2.39536c1.24524,0 2.25451,1.0722 2.25451,2.39536z"/>
   <path id="path2827" stroke="#000000" stroke-width="0.538" d="m46.44362,36.29185c0,1.24888 -2.54715,8.198 -11.35429,8.198c-8.80675,0 -10.37479,-6.67023 -10.37479,-7.91931c0,-1.24889 1.56804,2.54553 10.37479,2.54553c8.80716,0 11.35429,-4.07309 11.35429,-2.82421l0,-0.00001z"/>
  </g>
  <animate attributeName="x" to="350" dur="3s" repeatCount="10" />
  </svg>
 </g>
</svg>

Change the <object> element in index.html to the following:

<object width="100%" height="100px" data="animated_ghost.svg" type="image/svg+xml"></object>

Now when you preview the app, you'll see something like this:

WatzThis with an animated ghost!

Try pressing the OFF button in WatzThis for a truly scary effect.

Ghost on a black background in WatzThis app

The boss is sure to be impressed with animations like these!

What kinds of animated images would work for the apps you plan to develop?

Please join me in Chapter 5, and we'll wrap up another lesson.

Summary

You're already proficient at adding cool new features to an app, but in this lesson, we added a little sizzle to the steak. In other words, we turned our attention to graphics.

In this lesson, you found out about the differences between raster and vector graphics. Now you know why some low-resolution graphics look as if they're made out of color blocks.

You also learned about compression of raster graphics and about the two types of compression: lossy and lossless. (I didn't make up the word lossy! It's in most up-to-date dictionaries, and many programmers and designers are familiar with it.)

In addition, you discovered how to use SVG, the standard Web vector graphics language, to create and animate images.

In the next lesson, we're going to discuss specifically about mobile devices and how to optimize your mobile Web apps for different screens.

Until then, check out the Supplementary Material, FAQs, and assignment, and then test your knowledge in the quiz. I'll see you in the Discussion Area!

Supplementary Material

Clipart - High Quality, Easy to Use, Free Support

GitHub - SVG-Edit svgedit Powerful SVG-Editor on your browser

Free Online Image Optimizer · Kraken io

SVG Tutorial - SVG MDN

Lesson 9 FAQs

Q: I found some images on a website that I want to use in the app I'm developing. Can I just copy them and use them?

A: Probably not. You should assume that any content (including text, code, images, and video) on a website that you don't own is protected by copyright law unless the owner of the content specifically says otherwise. When in doubt, ask permission before using anything from someone else's website.

Q: What about Flash graphics? Can I use them in mobile apps?

A: Adobe Flash can do amazing things, and it works on nearly every desktop and laptop browser. Unfortunately, Apple's iOS doesn't support Flash content. If you decide to use Flash in your mobile Web apps, be sure to provide alternative content in another format (such as SVG or HTML5 video, for example) for the iPhone, iPad, and iPod Touch.

Lesson 9 Assignment

As you saw in this lesson, SVG is an XML vocabulary for creating vector graphics. Because it's XML, you can create all your SVG graphics using nothing but a text editor. In reality, however, drawing anything more than simple shapes requires some sort of visual SVG authoring tool.

Fortunately, many tools can create SVG files—including perhaps the most popular professional illustration tool, Adobe Illustrator.

Free tools such as SVGEdit are also available, and they're a great way to learn and experiment with SVG. To getstarted with SVGEdit, follow these steps:

Open your browser, and go to https://github.com/SVG-Edit/svgedit
Find the link on this page to try out the demo. You'll go to a new blank canvas in SVGEdit.
Open full size version
A blank canvas in SVGEdit

Try out the different tools in the toolbar and draw some shapes.