Lesson 11: Maximizing Mobile Performance

Lesson 11: Maximizing Mobile Performance

Introduction

The design team has taken the WatzThis app and added some "pizzazz" to it in preparation for its official launch. Wow! Check it out!

WatzThis with some classy design elements

The new, spruced-up app looks great. The only problem is that the testers are starting to complain that it's not as fast as it used to be. Your job is to figure out what's causing the delays and make WatzThis snappy again.

A quick test at tools.pingdom.com (a popular site for performing various tests, including a speed test on websites) reveals that the app loaded in 413 milliseconds before the designers got their hands on it. Now it takes nearly three times as long.

WatzThis used to be blazingly fast!

Redesign leads to slowdown of WatzThis

An additional 800 milliseconds may not sound like much, but consider that this measurement is under ideal circumstances and with a very high-speed Internet connection. Your typical mobile phone user will have much slower load times. It's unacceptable to tell them that they need to wait three times as long as before to use WatzThis.

Keep in mind that this service can only compare WatzThis to other sites that it's tested. So a drop from being faster than 98% of tested sites to being faster than 86% of tested sites may be significant, considering that you're competing only with site owners who care enough about performance to have their site tested.

In this lesson, we'll discuss about the topic of performance, and you'll learn how to make a Web app as fast as it can be. Try this brief quiz to see how much you already know about this topic. (I won't keep track of your score.) Then move ahead to Chapter 2.

Understanding App Performance

A simple way to define performance when it comes to Web apps—or any type of app, for that matter—is to measure how fast the app does what it's designed to do.

Several factors influence performance, including the speed of the user's Internet connection, the speed of the device's processor, and how far away the user is from the server hosting the Web app.

As the programmer, you can't control how fast your users' Internet connection is or the type of processors in the devices they're using. But you should do everything you can to minimize the amount of work that the user's device must do and the amount of data that must be transferred over the Internet. Your goal is to increase performance for any user who may want to use the app. Optimizing an app's use of resources is what programmers call performance tuning.

Latency is the waiting time between events in an app. For example, if you click a link and then wait two seconds for the desired page to appear, the amount of latency in that interaction was two seconds.

Latency is unproductive but unavoidable. As people have become used to faster websites and apps, their patience for latency has decreased. Today, even a fraction of a second more latency can be the difference between a user choosing to stay on one site or another. Google's research has found that a half-second longer load time for search results decreased traffic and ad revenue by 20%. Amazon found that its revenue increased by 1% for every 100 milliseconds faster the site loaded. For this reason, app developers put a lot of effort into reducing latency.

The Eight-Second Rule

In 2001, a study found that the longest a typical user would wait for a webpage to load is eight seconds. Today, this number is way too long for most Internet users. A much higher percentage of users have high-speed Internet connections. More recent studies have found that most broadband users won't wait four seconds for a page to load.

This infographic from Strangeloopnetworks.com shows the (very high) expectations that users have for mobile Web apps.

Mobile users demand performance Image provided by strangeloopnetworks.com

What techniques do website and app developers use to reduce latency?

  • Faster devices, networks, and servers: If you have a large budget, you can buy faster computers to host your Web app and spread it out over many servers around the globe. In theory, if you had enough money (or only a few users), you could also buy all of your users new smartphones and make sure that they have the fastest wireless connections. But . . . that's probably unrealistic. Over time, however, old smartphones and slow data connections are becoming less of a problem.
  • Caching data locally: Caching means storing Web files in a place where the browser can access them quickly later. Caching data locally, using one of HTML5's local storage options and the browser cache, is my favorite technique for reducing latency. Here's how it works: When a user first comes to your Web app, the browser downloads all the data needed to run the app. After this initial download, files come directly from the local storage, and only small amounts of data transfer from the server. This greatly reduces both the latency and the load on your Web server.
  • Using compression: As you learned in Lesson 9, compression reduces the size of files. The larger a file is, the longer it takes to transfer over the Internet. The opposite is also true—small files transfer faster.
  • Minimizing the number of files: Because Web browsers make a separate request to the server for each file that's part of a webpage, it's faster to transfer two files with a combined size of 100 kilobytes than it is to transfer 10 files with the same combined size. Where possible, combine files to reduce the latency that comes with HTTP requests.

Now for the big secret: Users don't really care about latency. What they care about is whether an app feels slow—its perceived speed. You may have a large amount of latency in your app, and the users may even have slow Internet connections, but if you keep the users busy looking at something else, they won't even notice.

When there's no way to reduce the actual latency any further, the trick is to distract users with shiny objects and magic to make them think that the app is faster and the latency is less than it is.

The tricks that you may have available for increasing the perceived speed are:

  • Loading JavaScript incrementally: Many modern Web apps contain a large amount of JavaScript code that must be downloaded in order for the app to function. Traditionally, JavaScript code has been placed in the <head> of webpages. The problem with this is when the user visits a page with a large JavaScript file in the <head>, that entire file must be downloaded before the user sees anything appear on the screen.

    By moving the JavaScript to the bottom of the page, you cause the page to display before the JavaScript loads. If users see something happening on screen sooner, they perceive the app to be faster—even though you and I know that it's the exact same size and load time. A problem with this approach is that the user can see that the page is still loading.

  • Deferring JavaScript evaluation: This technique simply downloads all of the app's JavaScript at once, whether the user needs it or not, and then caches it. So you have a larger up-front download, but everything happens much faster thereafter.
  • Preloading commonly used data: You can preload pages, scripts, and images that a user is likely see when first getting to the app. Doing this reduces the user's wait later on.
  • Using loader animations and progress bars: If users know that something is happening, even if it's just a spinning icon or a progress bar, they'll be more likely to be patient. You can find a variety of freely available progress bars and animated icons on the Web. In the Supplementary Material, I've included a link to a website that generates a customizable spinning icon using JavaScript and CSS.

Before you do any fine-tuning, you need to find out how big your problem is. This is where performance testing comes in, which we'll discuss about in the next chapter.

Using the Audits Tool to Gauge Your App's Performance

Google Chrome's built-in Audits tool tests how fast your Web app is and suggests how to fix common problems. Don't worry; it has nothing to do with the tax collector!

Follow these steps to use the Audits tool:

  1. Launch your Chrome browser, and go to the new version of the WatzThis app at http://www.watzthis.com/L11/watzthis/index-slow.html.
  2. Select Tools > Developer Tools from the Chrome menu.

    Launching the Developer Tools

  3. Once the Developer Tools are showing at the bottom of your browser, click the Audits button.

    Opening the Audits window

  4. The Audits tool can give you recommendations for improving the performance of your webpage. It can also tell you how to improve the way your page uses the network . . . how fast it downloads, in other words.
  5. Click the Perform an Audit button.
  6. Uncheck all of the checkboxes on the Audits to Perform screen except for Performance.
  7. Click Run. The page will reload. After a moment, you'll see Chrome's recommendations in the Audits window.

Chrome's performance improvement recommendations

Another effective tool for doing performance tests of Web apps is Google Page Speed. We'll look at Page Speed in this lesson's assignment. For now, proceed to Chapter 4 to find out what you can do about some of these recommendations from the Audits tool.

Fine-Tuning Your App's Performance

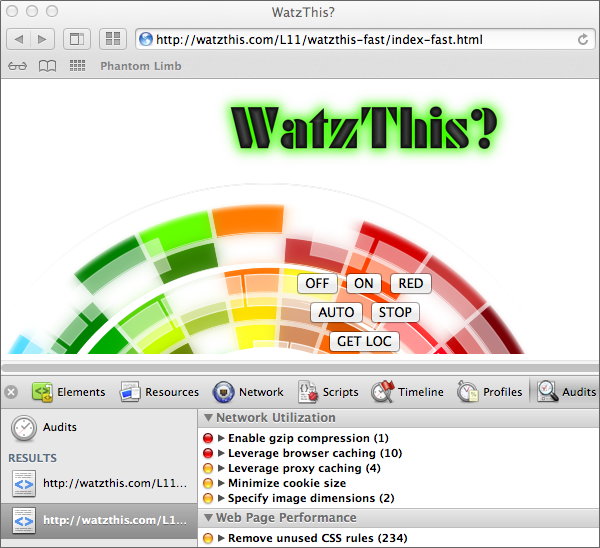
Take a look at the results that the Audits tool gave for our new, slower, WatzThis app. The items with the red bullets next to them are the ones we should address first because they have the largest potential payoff. So let's start at the top of the list and work our way through several of them.

Before we continue, visit the Supplementary Material for this lesson and download the Zip file I included. Then open up index-slow.html in Komodo Edit.

Future versions of Chrome may change the recommendations that the Audit tool gives or the order in which they appear. The principles are the same, however, and these same recommendations are solid ways to increase performance.

The first recommendation from the Audits tool is Combine External CSS.

If you click on the arrow to the left of the recommendation, the rule will expand and show you details. It turns out that the WatzThis designer added some new style sheets to the app, so we've gone from having one tidy little style sheet to having five. Here they are:

<link rel="stylesheet" href="includes/blueprint/screen.css" type="text/css" media="screen, projection">
<link rel="stylesheet" href="includes/blueprint/print.css" type="text/css" media="print">
<link rel="stylesheet" href="includes/blueprint/plugins/fancy-type/screen.css" type="text/css" media="screen, projection">
<link rel="stylesheet" type="text/css" href="includes/watzthis_part1.css">
<link rel="stylesheet" type="text/css" href="includes/watzthis_part2.css">

The first thing I notice is that there's a style sheet called "print.css" that has the attribute media of "print." Since it's unlikely that anyone is going to be printing out WatzThis, it's safe to remove this tag.

Next, the style sheet right under the print style sheet contains styles for manipulating text. We're not using any of these, so we can delete that tag as well.

The next style sheets are watzthis_part1.css and watzthis_part2.css. Open them both. Now copy all of the contents of watzthis_part2.css and paste it at the end of watzthis_part1.css. Your new file should look like this:

body {
  font-family:arial, helvetica;
  text-align: center;
  }
ol {
    display: inline-block;
    margin: 0 auto;
    text-align:left;
}
.bigButton {
    font-size:18px;
}
#middle {
  background:url("bigback.png");
}
#directions, #flashlight, #danceparty {
    margin:4px;
}
#container {
  margin-top: 10px;
}

Delete the tag that links to watzthis_part2.css, and now we're down to two style sheets. If I rerun the Audits tool on this page, you'll see that the recommendation to combine the external style sheets no longer comes up!

The next recommendation is Combine External JavaScript.

This recommendation is similar to the previous one, so I won't bother to go through each step of how to implement this improvement.

You'll see, however, that this latest version of WatzThis has organized all the different JavaScript that we've added to WatzThis into several files. Someone even added a few placeholders for files that don't even exist yet!

<script src="includes/touchit.js"></script>
<script src="includes/flipit.js"></script>
<script src="includes/locateit.js"></script>
<script src="includes/greatnewscript.js"></script>
<script src="includes/bestscriptever.js"></script>
<script src="includes/thisonewillbefun.js"></script>

While this may be great for people who are obsessed with organization, it slows down the app. The best thing to do is to combine the contents of the first three JavaScript files into one file (I'll call it watzthis.js) and include that instead of these six script elements. So replace all the JavaScript I listed above with this one line:

<script src="includes/watzthis.js"></script>

Once you make this change, if you rerun the audit, you'll see that the recommendation to combine the JavaScript files goes away.

Another recommendation on the Web Page Performance list is Put CSS in the document head.

Good catch, Audits tool! It looks as if one of the designers accidentally put the CSS links inside the body of the HTML document rather than in the header. By putting the CSS in the header, you give the browser the information it needs to style the page before it starts to display the page. That means the browser can display correctly styled content to the user faster.

To resolve this issue, move the remaining CSS links to somewhere in the <head> element—preferably before any JavaScript. The Audits tool doesn't tell you this, but CSS should come before JavaScript in a document whenever possible in order to optimize the page rendering speed.

With these three changes made, let's test the speed of WatzThis.com again.

Speed test tool shows the modified app running fast again! Speed test of the modified app

Compare these results to the results of the last speed test. We're making progress! The performance grade has shot up, the number of requests is down, the load time is slightly faster, and the page size is smaller! And we accomplished all this without changing the new design or removing any functionality!

WatzThis still has many areas in which its performance can be improved. Here are some of the things I would do:

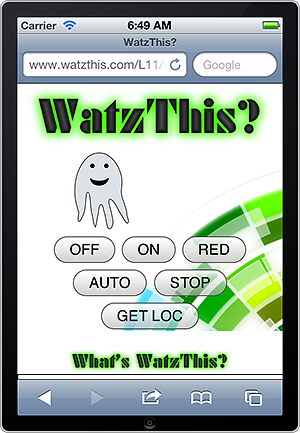
  • Optimize the background image. You can crop it to just the part that shows in the app and reduce the image quality somewhat in order to reduce the file size of the image.
  • Optimize the other graphics. The header graphic and the What's WatzThis graphic are both larger than they need to be. You can use an image editing program to reduce the dimensions of these images--and thus reducing their file sizes.
  • Remove unused CSS rules.

Can you think of some additional optimizations? I'm looking forward to hearing your ideas for additional improvements in the Discussion Area!

Please continue to Chapter 5 to wrap up another lesson.

Summary

In this lesson, we focused on mobile Web app performance.

You learned about latency and perceived speed. You also discovered some of the techniques that app developers use to improve their apps' performance.

Then you used the Audits tool to get recommendations for improving the performance of WatzThis. After that, you implemented some of the Audits tool's recommendations and retested the app. You found out that performance tuning really does make a difference.

In the next lesson, you'll learn about the ultimate performance improvement for Web apps—converting into a native app.

For now, step right up and take the quiz, check out the Supplementary Material, read the FAQs, and do this lesson's assignment. I'll see you in Lesson 12!

Supplementary Material

Best Practices for Speeding Up Your Web Site - Yahoo Developer Network

spin js

PageSpeed Insights Rules PageSpeed Insights Google Developers

Free Mobile Performance Testing with Akamai's Mobitesti

JSCompress - The JavaScript Compression Tool

WatzThis

Pingdom Website Speed Test

PageSpeed Insights

I finally made sense of front end build tools You can, too

jekyll Transform your plain text into static websites and blogs

Browser Caching

How to leverage browser caching of your website or blog

Leverage browser caching GTmetrix

How to Edit Your Website’s htaccess File in Dreamweaver

Where can i find the htaccess file in dreamweaver - Google Search

HTTP Caching Web Fundamentals Google Developers

HTTP Cache-Control Web Fundamentals Google Developers

How do I make a browser cache - Google Search

How do I make a cache manifest file - Google Search

Cache Manifest Tutorial HTML5 - YouTube

Leverage Browser Caching - Google Search

Browser Caching Example - Google Search

Lesson 11 FAQs

Q: I noticed that pingdom.com and Google Page Speed both gave WatzThis a performance score, but the scores are different. What does this score mean, and why isn't it the same in both places?

A: These performance scores differ because there's no standard Web app performance score scale. Google, Pingdom, and other services that offer evaluations of Web app speed have their proprietary systems for ranking page speed, and these are useful only in comparing results of tests done using the same service.

Q: What's the single most important thing to do in order to speed up my Web apps?

A: There's no magic bullet to Web app performance. Each Web app is one of a kind, and you should use tools such as Google Page Speed and the Web Inspector to find out what your app needs.

Q: When I use Chrome's Audit tool or Google PageSpeed to get suggestions for speeding up my website, one of the suggestions is to Leverage Browser Caching. What does that mean, and how can I do that?

A: When a Web page is downloaded from a server, the server also sends information about how long the user's browser should cache the different types of files used by that page before downloading them from the server again. This information is called the expiry date or the maximum age. By setting the maximum age value higher, you can reduce the amount of data that Web browsers need to download, thereby increasing the performance of your website. The method for leveraging the browser cache depends on the type of Web server where your site is hosted. To read more about browser caching, go to Google Developers—HTTP-Caching
One method for setting expiry dates is to modify or create a file called .htaccess. You can learn more about this method by going to GTmetrix—Leverage Browser Caching.

Lesson 11 Assignment

Testing Performance with Google Page Speed
To use Google Page Speed to test mobile sites, follow these steps:
Open your Chrome browser, and go to Google PageSpeed Insights

Enter www.watzthis.com/L11/watzthis/index-slow.html into the form on the page.

Google Page Speed

Click Analyze. After a moment, you'll see the results of the test.

Results of the page speed test

Below the scores, take a look at the Suggestions Summary, and compare Google's recommendations to the ones that the Audits tool gave. Are they similar? Are there any recommendations that one tool gave that the other didn't?

Results of the mobile speed test

Some of the recommendations that the two services give can be implemented only if you have direct access to the server hosting the app. But it's easy to implement others by adjusting the markup code, JavaScript code, CSS, and images. Think about which recommendations you might be able to implement using the skills you've learned in this course. When you're ready, head over to the Discussion Area and share your ideas.
If you have access to a Web server, try some of the improvements, and then rerun the mobile page speed test. If you don't have access to a Web server, try rerunning the test with my optimized version of the app at http://www.watzthis.com/L11/optimized/index.html